Ecologically sustainable forestry is the goal. Learn how to use forestry tools and techniques for forest inventory sampling methods to maintain healthy woods.
When you think of home-scale forest management, you might imagine using a chainsaw to gather your own firewood and lumber, or perhaps creating a process to monitor for and clear out invasive and diseased trees. Yet, managing a backyard woodlot can also yield myriad additional products, including boughs for seasonal decor; poles for all types of buildings; syrup; and plenty of foraged mushrooms, fiddleheads, berries, and cones. Thoughtful management can increase species diversity and lead to a more resilient forest better able to withstand disturbances from insects, wind, or wildfire. Even if the primary use for your forest is recreation, you might want to build walking trails or open access to hunting, stream fishing, or forest bathing.
Ecologically Sustainable Forestry
Given all the benefits forests provide, you likely have forestry goals, even if you haven’t formally stated them. But owning and managing forestland can be intimidating. Worries about “doing it wrong” or just plain wondering where to start can lead the would-be woodlot manager to procrastinate. Learning basic forestry principles and tools will make the endeavor a lot less daunting.
A landowner familiar with their forest will make sound decisions and be more likely to achieve their goals. Let’s look at some basic ideas and simple tools – including some you can make yourself – to get you going.
When to Work with a Forester
To manage a woodlot successfully requires a forest owner to either hire a professional for everything, DIY it all, or blend the two approaches – my favored choice! I think of this method as similar to animal husbandry: Some tasks you can handle, while others are best left to a veterinarian. Even when you can’t identify a problem, noting a change that doesn’t look right can allow for early action to research a solution. Engaged landowners understand what’s happening on their land and use that knowledge to make decisions that are right for them.
Hiring a forester is nearly always recommended if you plan to sell timber – and the amount you pay them for their service can be more than returned through the increased revenue from a well-managed sale – but be prepared for a short supply of foresters in some areas. They may be less willing to take on smaller jobs, such as compiling a simple inventory, without also setting up a harvest.
Start by obtaining a working knowledge of your forest and its conditions. The steps below will show you how to gather data to provide a general inventory, rather than a full timber “cruise,” of which species, sizes, and densities comprise your woodlot. This baseline assessment is within most landowners’ capabilities – and can provide significant cost savings for times when working with a professional is essential.
Measure Basal Area and Diameter at Breast Height
Trees are plants, but unlike your peppers and tomatoes, the trees in your forest will grow and mature over decades, changing the value and density of your woodlot. A poor decision can have repercussions for more than 100 years! Quantitative information, routinely updated, will give you the basis for making sound management choices. Cataloging your species composition, basal area, and tree diameters is an excellent place to start.
Species composition. Oak, aspen, maple, fir, spruce, gum, birch, beech, ash, and more: What species do you have? A group of trees growing together that share characteristics similar enough to be managed as a unit is called a “stand,” and while very few natural stands are predominantly one species (known as “pure stands”), trees of a feather often stick together. Certain species can usually be found growing near one another, because they all like the same moisture level, soil type, or amount of sunlight.
You may notice that your forest is mostly maple, basswood, white ash, and yellow birch. Or that beech-fir is a common mix near you. Species composition will inform your management decisions. Upland and lowland forests can feature entirely different species, so if you have both, consider them separately.
Basal area (BA)
Foresters measure many parameters, and basal area is among the most commonly utilized. It’s what many foresters I know measure first when they’re out in the woods. So, what is basal area? BA is the area, in square feet per acre, of the tree stems if measured 4-1/2 feet off the ground. Another way to think about this is as the total area of all the stumps of all the trees in 1 acre if you cut them off at breast height. In this way, BA is a measure of forest density.
The basal area can help a forester determine if a stand is adequately stocked (with a well-stocked stand considered to maximize the space for healthy competition) and provide some guidance for marking timber (indicating trees to be removed or harvested). Obtaining BA is a quick measurement after you’re familiar with it.
Diameter at breast height (DBH)
Trees are often described using their diameter and species; for example, a 14-inch white oak. For standing trees, DBH is measured at 4-1/2 feet above the ground and taken at this height to account for stump flare for that species.
How to Measure Forest Stands
In addition to determining what data to gather in your woodlot, you’ll decide how to gather it. Foresters use two primary methods: sample plots and a 100 percent tally (counting every tree). Sampling is the usual method, because counting and measuring every tree in an 80-acre forest – or even an 8-acre forest – would be time-consuming, prohibitively expensive, and (usually) statistically unnecessary. Instead, you can take sample plots to estimate actual values.
Fixed-Radius Plots
As it sounds, for fixed-radius plots, a radius of a given value is used to describe a circle, and every tree within that circle is counted, measured for diameter, and tallied. The results are then mathematically expanded to the entire stand.
For example, a 1/10-acre plot has a radius of about 37 feet. (Save yourself the math and ask the web for the radius of any plot you know the acreage of.) A 1/10-acre plot with seven “count” trees – those you’ll document in your tally – would be extrapolated to represent 70 trees per acre.
Variable-Radius Plots
The most commonly used plot technique for timber cruising in many regions of the United States, variable-radius sampling involves counting trees as “in” or “out” using a prism or a cruising stick (more on those later), and tallying the results. “In” trees are then measured for diameter (DBH) and sometimes for the number of pulp sticks or sawlogs within the tree.
As a term, “variable radius” alludes to the use of the prism or cruising stick. To be a “count” tree, a small tree must be pretty close to the plot center. A large tree can be farther away from center and still be tallied. As such, there is no set radius. The process sounds difficult, but a prism or cruising stick makes it easy.
100 Percent Tally
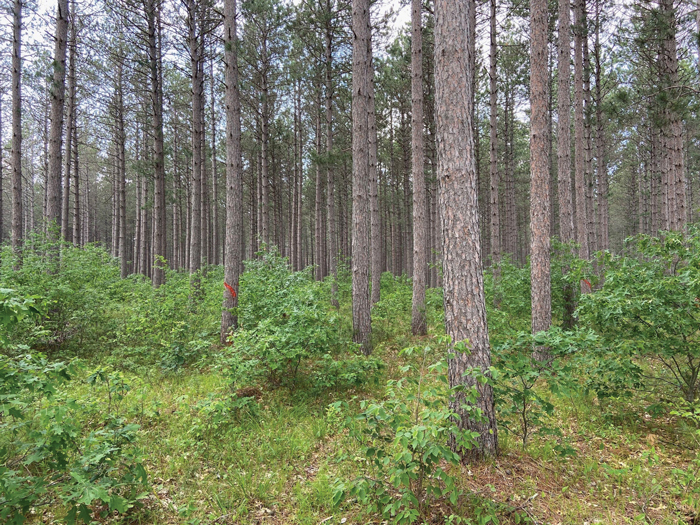
High-value or relatively small stands are sometimes cruised with a 100 percent tally. A complete tally in a small stand may be fun for the DIY landowner. However, the numbers quickly work against you as stand size increases: A hardwood stand with a 12-inch average DBH and a BA of 120 (which isn’t uncommon) will have about 150 trees on each acre. A 100 percent tally on a 10-acre stand would mean measuring and tallying 1,500 trees! Given this, some landowners will 100 percent tally only trees of a given high-value species, such as walnut.
Accuracy. Of course, any sample is only an estimate of the actual stand’s value. Forests aren’t homogenous across their entire area, so a plot taken in one spot could have entirely different results from a plot taken in another portion of the woods. We counter this discrepancy by taking multiple plots and averaging them together.
The level of accuracy you desire from your survey can determine the number of plots you take. If you’re merely curious about what timber might be out there, a plot every 2-1/2 acres is sufficient. I recommend making decisions about harvesting or thinning using higher-fidelity data; about one plot per acre will usually give satisfactory results.
How to Use Forestry Tools
A prism and D-tape, or a good cruising stick, and a pad of paper are all you’ll need to start inventorying your forest, assuming you can identify the tree species in your woodlot (and if you can’t yet, carry a reliable tree-identification book with you and refer to it often).
Prism
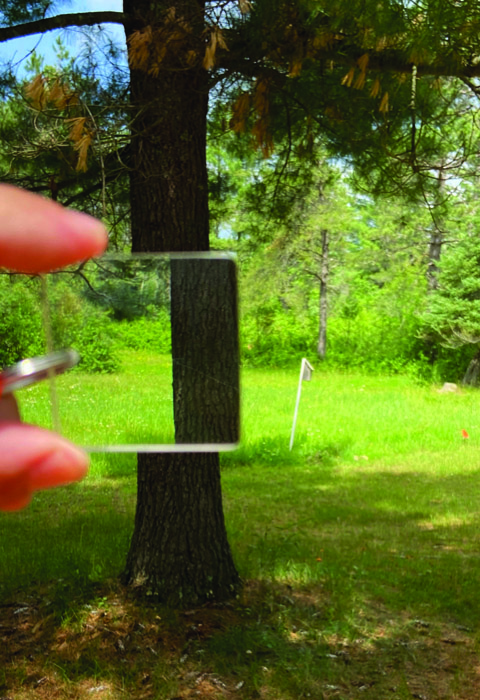
The prism is one of the most common forestry tools, and simple to get the hang of. It’s used in variable-radius plots to measure BA. Prism manufacturers grind them to specific angles, which give them a “factor”: 5, 10, 20, 30, and so on. If you aren’t sure which prism to buy, go with a 10, which is commonly used in the eastern U.S.
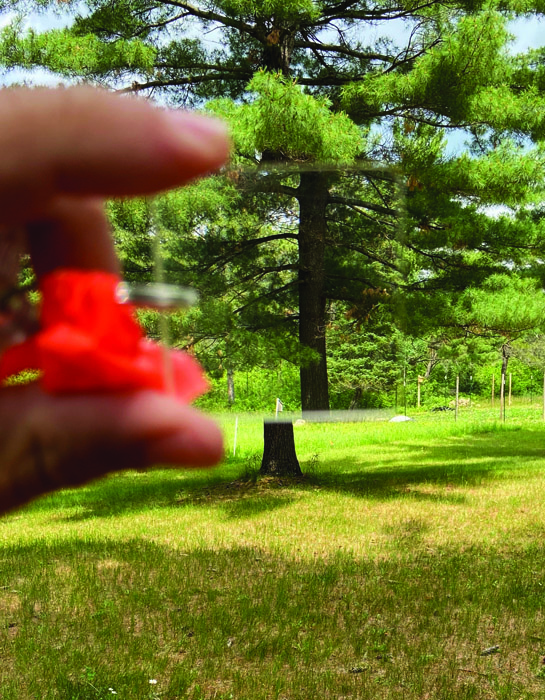
When using a prism, think of yourself as the moon and the prism as the Earth – you rotate around the prism, while the prism stays at the plot center to determine which trees to include in the plot count. Sight trees by looking through the prism with one eye (keep the other closed), which will cause the portion of the tree seen through the prism to separate from the rest of the trunk. You’ll count the tree, or not, depending on whether the portion is wholly displaced from the trunk or still overlaps. An overlapping trunk is an “in,” or “count,” tree. One where the trunk slice is separated from the bole (the main trunk of the tree) is an “out” tree and isn’t counted. Keep track with a simple dot-tally form. At a minimum, I like to record species and DBH of each count tree.
Cruising Sticks
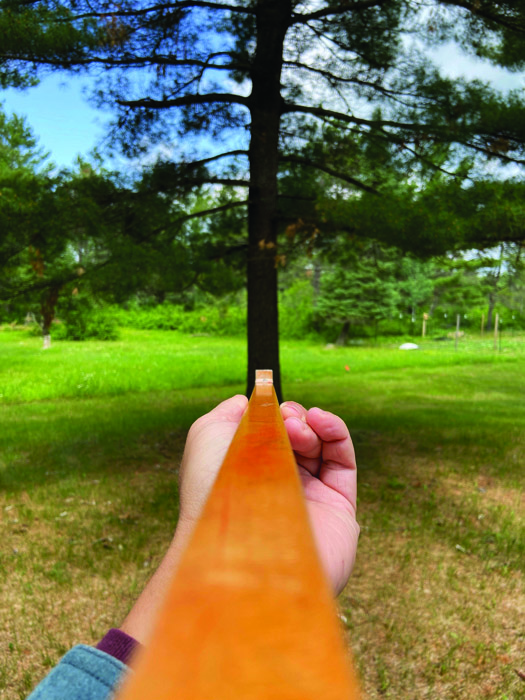
Cruising sticks are my favorite forestry tool, and you can make your own. Cruising sticks replace the prism for variable-radius plots. You can find videos and articles online showing how to make a cruising stick, but the general idea is to create a stick that’s calibrated on one side to provide DBH and on the other side to provide tree height at a standard distance from the base, usually one chain (66 feet). Attach a piece of metal calibrated to use as an angle gauge for measuring BA.
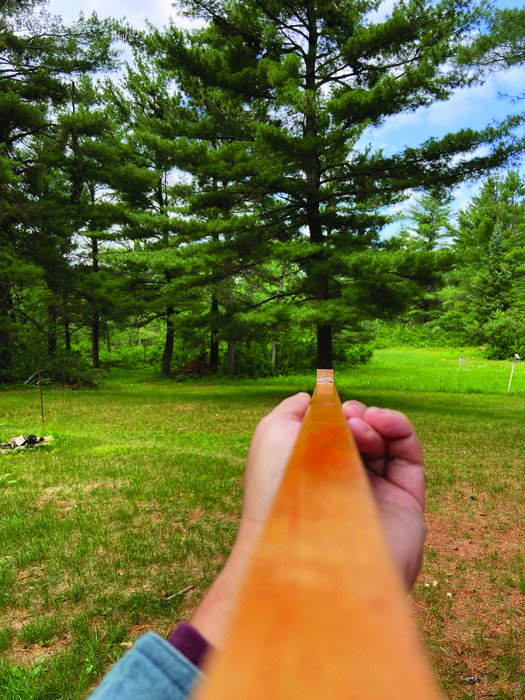
To use a cruising stick, stand at the plot center and rotate like a rotisserie chicken, pointing the stick out at eye level. The tree is counted when its trunk is larger than the metal gauge. (Unlike when using a prism, you’ll stay at the plot center while the stick rotates around you.)
Diameter Tape
A diameter tape (“D-tape”) does the math for you. You’ll need one if you don’t have a cruising stick. Typically made of metal and resembling a flexible tape measure, D-tapes are calibrated using pi to directly read diameter measurements. Wrap the tape around a tree, keeping it level and 4-1/2 feet above the ground. The tape will then give you the DBH.
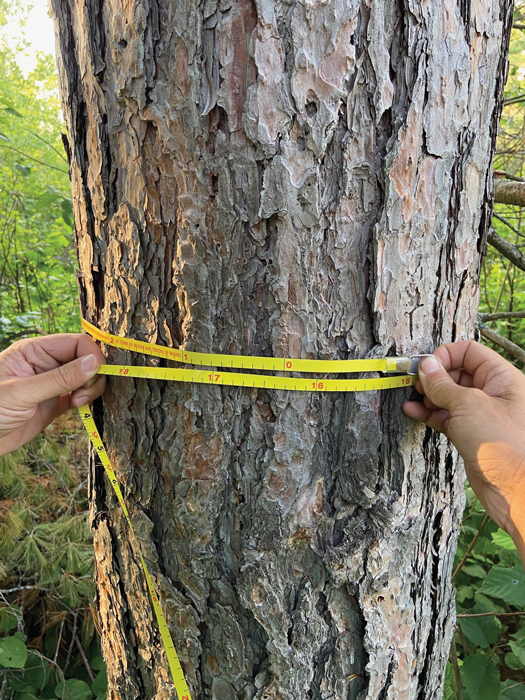
While a good D-tape isn’t prohibitively expensive, you can easily make your own for casual use. Because diameter equals circumference (what the tape is starting with, given it wraps around a tree’s trunk) divided by pi, we can take any flexible tape or rope and mark it off in 3.14-inch intervals. Label these intervals 1, 2, 3, and so on, to read off as DBH in inches.
Whether using a prism or a cruising stick, home woodlot owners will find it easier to take plots with a partner. The first person uses the prism or cruising stick to identify and count trees, and the second person measures the DBH. It makes sense for either of you to record.
There’s little need to measure down to 1/10 of an inch for cruising. In fact, most forestry cruises are completed using 1-inch-diameter or 2-inch-diameter classes.
Tally Sheet Recording & Calculating
Record your data in the field, whether using a high-tech tablet or pad and paper. In my experience, while nice apps are available, a dot-tally sheet works fine.
Calculate BA for variable-radius plots by summing all the count trees and multiplying by your prism or cruising stick “factor.” Divide by the number of plots taken to get an average BA. If you took fixed-radius plots, you have some math to do, which is easier with a spreadsheet. Find examples online.
Here’s a variable-radius example, where we’ll use this standard equation:
- BA= (count trees/number of plots) Prism factor
Let’s assume you took 17 plots using a prism with a BA factor of 10 and counted a total of 161 “in” trees. Plugging these values into the equation, you get BA = (161 ÷ 17) × 10.
Running the numbers yields BA = 94.7 – and then you round to 95, because BA is reported as whole numbers, never decimals.
You can average tree diameters by species to indicate the general size of trees in your forest. For instance, you might find that the average DBH of white oak in your back 40 is 11 inches.
Empowered by a host of hand-collected data, cruising your own timber stand opens up all sorts of management opportunities. You’ll understand how much to thin for timber production, how much you can sustainably cut for firewood, where to create wildlife openings, and more. After you start taking an interest in quantifying your woodlot, you’ll have a new way to connect to your land and be able to make sound forestry decisions.
Andy Wilcox is a freelance writer, flower farmer, and Master Gardener with a passion for soil health, small producers, forestry, and horticulture. He and his partner run Stone’s Throw Flowers, providing cut-flower arrangements to retail and wholesale customers. He’s also a forester and an active member of the Farmer Veteran Coalition of Wisconsin.