
Learn how to read a surface weather map and understand the weather symbols on a map to stay informed with this classic skill.
A weather map, a map of North America (or other global regions) that shows weather systems, has been a visual tool used by meteorologists to depict and explain the weather for over 100 years. Actually, weather maps have been around since the 1800s and have become a staple in public weather reporting.
So, what are we actually looking at?
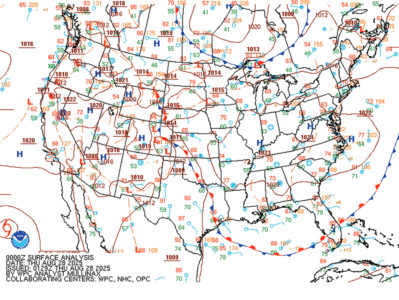
First, this is a surface map showing weather systems at the Earth’s surface at a specific time. As you go up in the atmosphere, there are different weather systems. Weather observations are taken at official sites every three hours starting at 00:00 GMT. These observations are then plotted for each site on a base map following a standardized format, a station model developed many years ago. Today, this is done by computer. Back in the old days, these were plotted by hand. (And, yes, I made my meteorology students do this to show them what it was like.)
The basis of the surface map is the pressure field, the atmospheric pressure measured by a barometer at these weather stations. The lines you see all over the map are called “isobars,” lines of equal pressure. The numbers on the lines represent pressure values expressed in millibars, a standard unit of pressure measurement.
The pressure field will show you where high- and low-pressure areas are located. These will often be circled by concentric isobars, with the pressure either maximized or minimized in the center. Highs and lows are actually spinning columns of air, with highs spinning clockwise and lows spinning counterclockwise (the opposite is true in the Southern Hemisphere).
Weather Symbols on a Map
High-pressure areas, depicted with an H (in blue if color is used), tend to have sinking air spreading out from the center and are usually associated with fair weather. They can be hot or cold, dry or moist, depending on where the high originated.
Low-pressure areas, depicted with an L (in red if color is used), have air converging into their center where it rises. If moisture is available, clouds and precipitation will form, so lows are the classic storm systems. Lows are often associated with fronts.
Fronts separate cooler air from warmer air. Because they separate two high-pressure areas, they’re associated with lower pressure.
A cold front is the leading edge of colder air that’s advancing. It’s depicted by a line (in blue if color is used) with triangles on one side pointed in the direction the front is moving. Cold fronts are typically associated with showery precipitation that usually dissipates quickly after the front passes. If moisture is limited, the front may bring only clouds but no precipitation. As the front passes, winds typically shift from a southerly direction to a westerly or northerly direction, ushering in the cooler air.
A warm front is the leading edge of advancing warmer air. It’s depicted by a line (in red if color is used) with semicircles on one side pointed in the direction the front is moving. Warm fronts are typically associated with steadier precipitation (rain or snow) ahead of the front.
Thunderstorms in the colder air ahead of a warm front are unusual but can occur. As the front passes, winds typically shift from an easterly or northeasterly direction to a southerly or southwesterly direction, ushering in the warmer air.
Stationary fronts are, as the name implies, fronts separating cold from warm air, but they aren’t moving much either way. They’re depicted by a line (alternating red and blue if color is used) with triangles on one side and semicircles on the other.
An occluded front can be similar to a cold front or warm front, but without major changes in temperature, like a front that’s separating a cool air mass from a cold air mass. It’s depicted by a line (in purple if color is used) with alternating triangles and semicircles on the side toward which the front is moving.
Occasionally, you may see other weather systems depicted on the map. Troughs of low pressure (with no closed isobars or changes in temperature) are depicted with dashed lines. They can bring precipitation.
There’s also what’s called a dry line, which separates moist air ahead of it from dry air behind it. A dry line can be found in the Plains region during spring and summer. Thunderstorms, possibly severe, can occur in the moist air right ahead of the dry line. A dry line is depicted on a map by a line with open semicircles on the side toward which the line is moving.
A squall line, a line of thunderstorms, is depicted with alternating line segments separated by two dot clusters.
Often, precipitation is depicted on the map. For a current map, this is usually derived from radar reports. As for colors, green represents rain, and darker green indicates heavier rain. Blue is for snow. Red typically means thunderstorms.
There are also official symbols for different types of precipitation. Two dots indicate rain, two commas indicate drizzle, and two stars indicate snow. A triangle indicates showery precipitation (rain or snow). Three horizontal lines indicate fog. The symbol for a thunderstorm is a combination of a “T” for thunder and a broken arrow for lightning.
National Weather Service weather maps for the United States can be found at the link.
For more than 30 years, Ed Brotak taught college students about weather, and he’s helped many pursue careers in meteorology. He lives in Asheville, North Carolina, with his wife, Liz.
Originally published in the November/December 2025 issue of Grit magazine and regularly vetted for accuracy.


